Part I. The argument
A data center arrives with a large appetite for electricity. Whether its arrival raises or lowers everyone else’s bill depends on what the grid must build to serve it, when it consumes power, and what it pays for. A data center that demands full power through every constrained hour can require substantial new infrastructure. A data center that uses spare capacity, reduces demand when the system needs relief, and finances dependable flexibility can help spread shared costs across more productive use.
That is the proposition of this paper: data centers can make electricity more affordable for existing customers when they participate in and fund enough flexibility to leave a positive net contribution to the system, and when rates deliver that contribution to those customers. The word “enough” matters. It must be established at the actual connection, against the costs of serving the new demand, with enforceable commitments about performance and payment.
The opportunity begins with the way the grid is built, becomes useful through flexible connection terms, and becomes investable when physical relief earns a recognized right to use capacity. The following five steps explain that chain. The study then tests its physical and operational foundations. The pilot is designed to establish whether it can work as a repeatable commercial arrangement that benefits existing customers.
1. The grid has spare capacity, but access to it is conditional
Electricity grids are designed around demanding moments: a hot evening, a cold morning, a transformer out of service, or several failures in a network that must keep operating. Customers pay for the equipment throughout the year. Much of the time, demand sits below its rating. The resulting headroom is real, but its availability changes with the hour, the location, and the condition of the system.
An average utilization value cannot tell a new customer how much power it can take. A transformer may have room while the feeder connecting the site does not. A feeder may be thermally adequate but reach a voltage limit. A local network may be unconstrained while generation or transmission is scarce. Capacity has to be followed through the whole electrical path, from the bulk transmission system to the customer’s meter, to accurately understand the available headroom.
Reliability planning adds another condition. Under an N−1 standard, the network must withstand the loss of at least one component. Capacity reserved to carry demand after a failure cannot also be promised as uninterrupted service to a new customer. It can, however, support a different service: permission to consume while the equipment is available, paired with an obligation to reduce consumption when it is not.
This distinction explains why a map of unused substation capacity is a starting point rather than an inventory of ready connections. The public-data study finds a substantial opportunity, but much of it is fragmented into distribution-level blocks of roughly 5–50 MW. That fits a fleet of smaller compute sites better than a single hyperscale campus. Even within that fleet, each site needs an available feeder, a physical connection position, acceptable protection and voltage behavior, and a viable path through the upstream system.
There is also an economic distinction between unused equipment and free electricity. Additional load still requires energy, capacity, operations, and sometimes upgrades. The affordability opportunity arises when a new customer’s payments exceed the additional costs it imposes and help cover costs existing customers would otherwise bear. Greater use of a transformer can contribute to that outcome; it cannot establish the outcome by itself.
2. Flexible connections let compute use that capacity
A conventional connection asks how much demand can be served through the planning contingencies. A flexible connection asks how much can be served under specified conditions, and what the customer must do when those conditions change. The second question can have a much larger answer because it does not require every connected megawatt to remain available at every moment.
The service is an operating envelope: a permitted level of import that can vary over time, together with a firm fallback and clear rules for emergencies. Day-ahead limits let a site schedule work and prepare storage. Faster signals respond to changing conditions. Automatic curtailment reduces demand when equipment becomes unavailable or a constraint is approached. Compliance is measured at the site meter, where the utility can determine whether the customer stayed within its obligation.
Compute offers several ways to respond. Some jobs can pause, checkpoint, or move to another location. Rack power caps can reduce consumption. Onsite storage can bridge a transition or cover a short event. The appropriate combination depends on the workload: an interruption-tolerant training job and a service-level-bound inference workload place very different values on the same curtailed hour. A flexible contract therefore needs an operating design.
At PG&E, the study illustrates how consequential that distinction can be. Its modeled room rises from 0.44 GW under conventional N−1 planning to 6.45 GW at normal transformer rating with contingency runback. The equipment has not become larger. The customer has accepted conditional access to capacity that could not be offered on firm-service terms. This is the largest modeled change in the study; targeted DER then improves the availability and size of that opportunity.
One useful way to express the service is through capacity tranches. A firm floor is available under the agreed planning conditions. A conditional tranche uses otherwise available headroom and must curtail when required. A resource-backed tranche can remain available more often because verified flexibility relieves the relevant constraint. These are contractual descriptions of the same physical system, not three independent pools of capacity. All remain subject to their stated outage, switching, duration, and fallback rules.
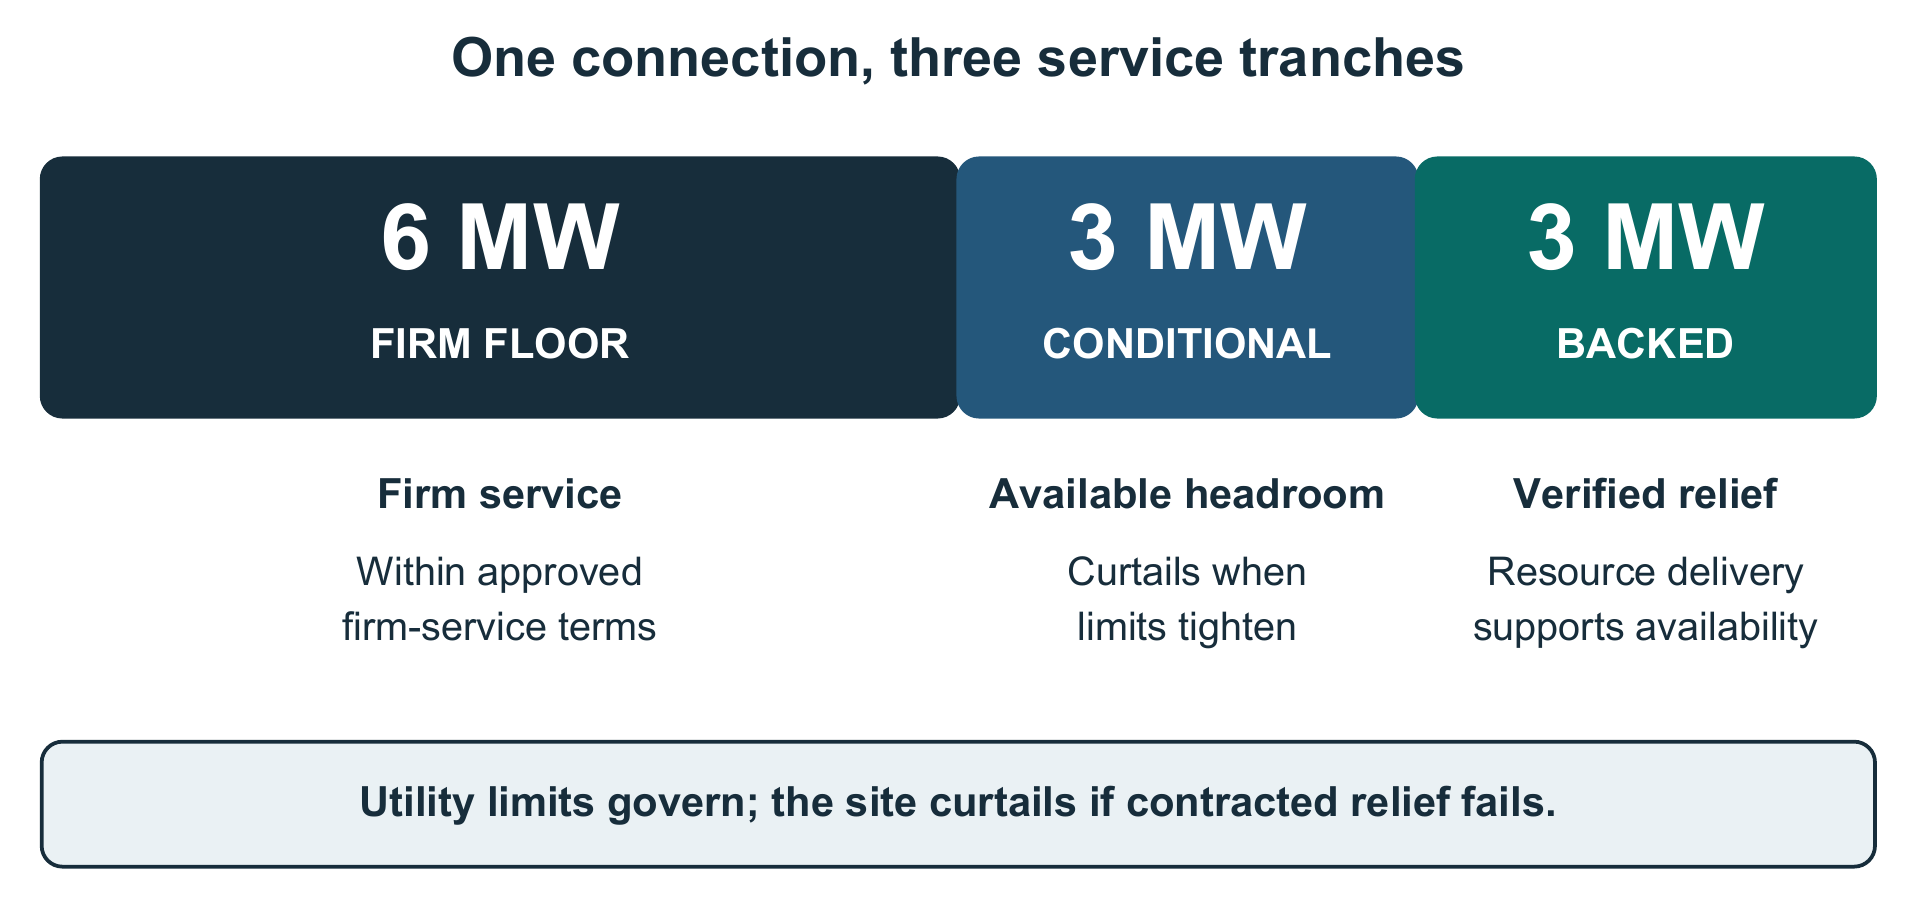
Figure 1. A hypothetical 12 MW connection divided into firm, conditional, and resource-backed tranches. The 6/3/3 MW split illustrates service obligations; it is not a modeled site or a guaranteed entitlement.
The public benefit depends on making that operating bargain reliable. A new customer can help support existing assets while avoiding some expansion, but only if its flexibility actually arrives when required and its tariff contribution exceeds the additional costs of service. The contract must make those obligations measurable, including what happens when the site reduces demand permanently or exits.
3. Targeted DER can improve the economics
A compute customer does not have to meet every flexibility obligation by interrupting its own work. It can also pay for batteries, managed charging, or controllable demand elsewhere on the network. Those distributed energy resources—DER—can relieve the equipment limiting the connection, allowing the compute site to operate for more hours or, where approved, at a higher import limit.
Location determines whether the relief counts. A battery across town may reduce system demand without helping the transformer serving the data center. A resource behind that transformer may still fail to relieve a downstream feeder constraint. Eligibility must follow the electrical topology, including changes after switching. The relevant “neighborhood” is the set of resources that can affect the binding equipment, rather than a convenient geographic boundary.
Timing and duration matter just as much. A resource must deliver during the constrained hours, remain available through the event, and recover without creating another peak. A four-hour battery cannot be treated as a full substitute for a day-long outage. A thermostat portfolio can produce useful initial relief and then a damaging rebound if recovery is unmanaged. A megawatt of enrolled nameplate capacity is therefore not automatically a megawatt of dependable constraint relief.
Bring Your Own Neighborhood, or BYON, gives this arrangement a financing model. The compute developer becomes an anchor buyer for useful local flexibility, paying an aggregator or resource owners for availability and measured performance. Homes and businesses can receive compensation; distributed batteries may also provide backup power where equipment, islanding capability, and reserve rules support it. The developer gains earlier access, fewer curtailed hours, or a better operating envelope.
The customer remains responsible for its connection. If contracted resources under-deliver, the site must reduce its own import. Onsite storage, direct compute flexibility, and neighborhood resources should be compared on the same basis, with the least-cost dependable combination selected for the actual constraint. Some workloads will be better served by simply accepting curtailment. Others may justify buying additional availability.
Community value has two distinct routes. Participants receive payments or other contracted benefits for supplying resources. Customers who do not own a battery, cannot invest capital, or choose not to participate can benefit through lower shared costs and the rates that recover them. The pilot must test both routes, including access for renters and smaller businesses, how much developer spending reaches resource owners, and what happens to locally installed assets if the compute customer leaves.
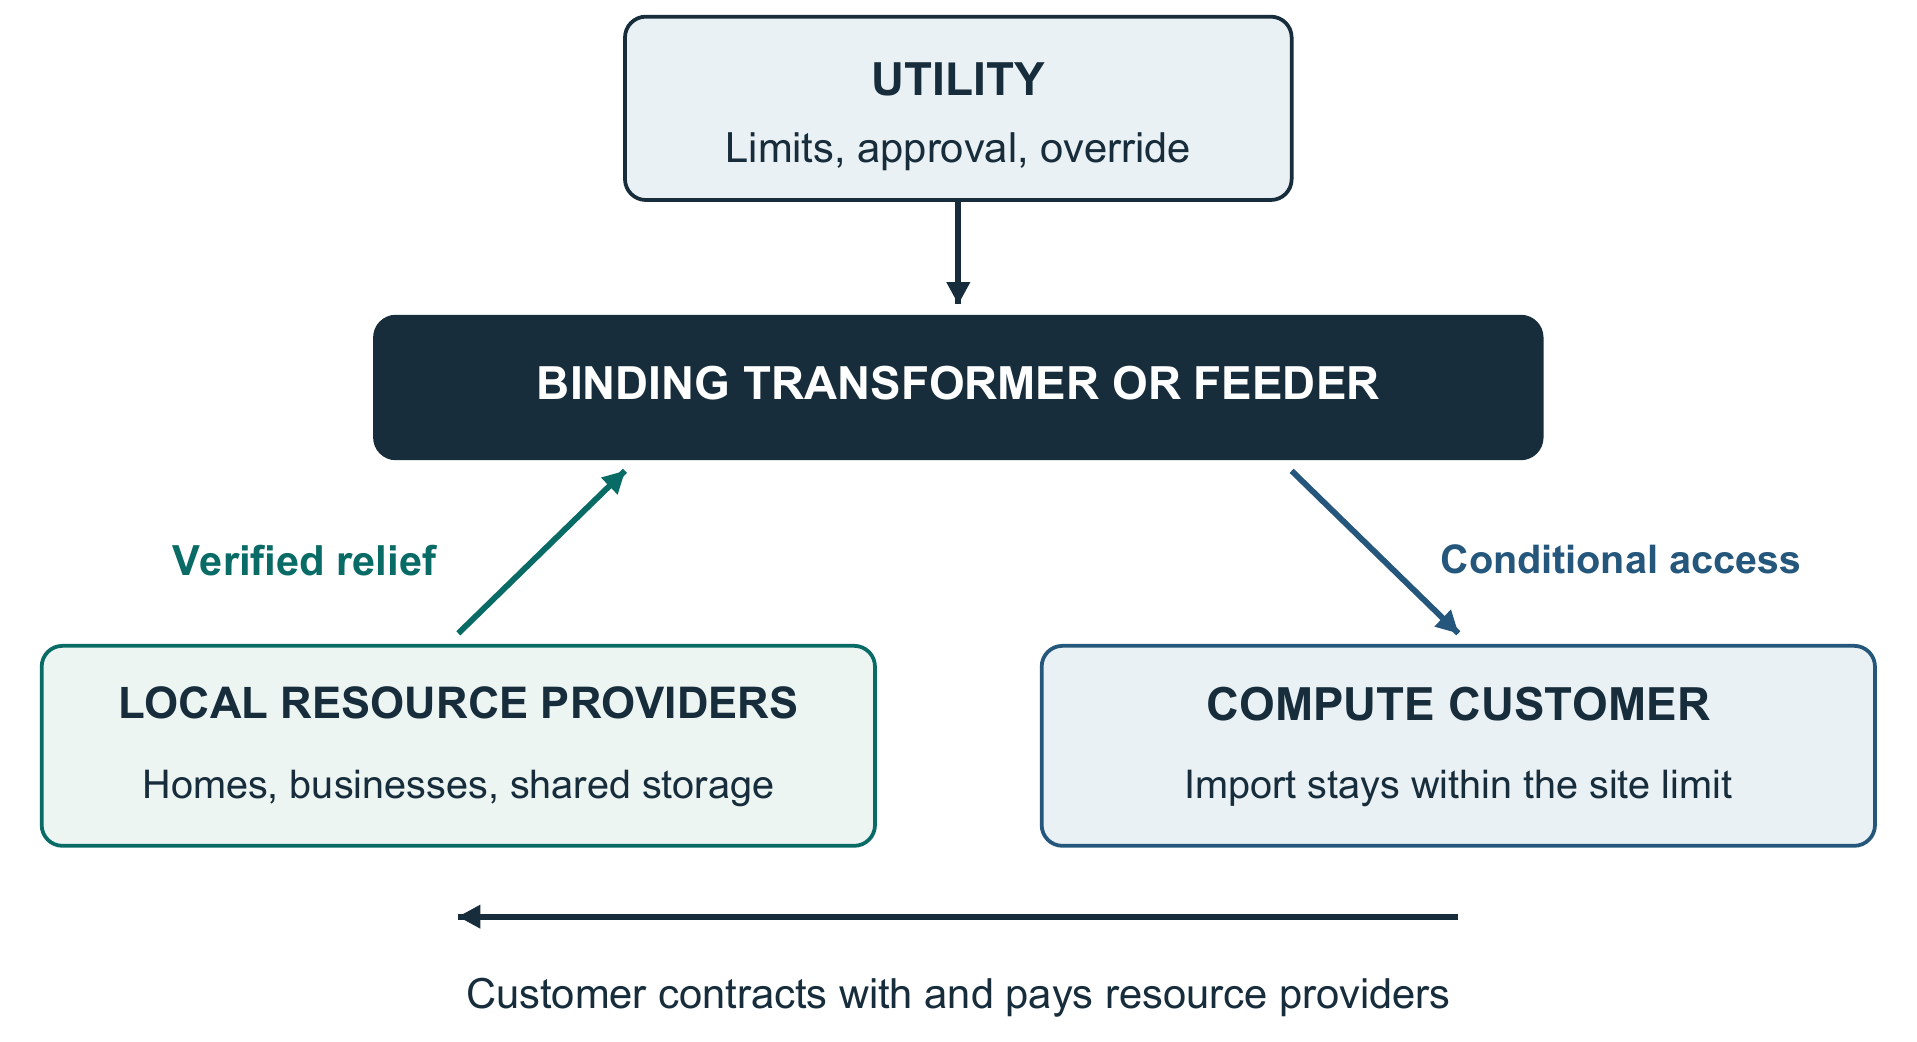
Figure 2. BYON assigns control to the utility, delivery obligations to local resource providers, and funding and site-limit compliance to the compute customer. Resource shortfalls trigger site curtailment.
4. Physical relief needs contractual recognition
Electricity responds to physical dispatch. A connection agreement responds to the rules written into it. The two need to be connected deliberately. A battery may lower loading on a transformer without giving the compute customer permission to exceed its existing meter limit.
Under the PG&E Flex Connect framework assessed here, hourly limits are issued the day before from a buffered forecast. Live measurements can lower those limits through failsafes, but reductions delivered elsewhere do not automatically raise the customer’s allowance. Informal DER dispatch can improve the physical situation while leaving the commercial constraint largely unchanged.
The study makes this distinction concrete by applying PG&E-style rules to five Con Edison stations. Relative to a no-DER baseline, informal dispatch leaves 87% of curtailed energy. Explicit credit for a day-ahead DER schedule reduces that figure to 39%; adding hourly limit updates reduces it to 24%. These are modeled comparisons, not field results or a forecast for an approved tariff. Their significance is that the recognition mechanism changes how much of the physical relief the customer can use.
Recognition also prevents a dangerous ambiguity: a customer cannot treat an offsite reduction as permission to ignore its own limit. Nor can the same relief be counted once in the utility’s forecast, again in an existing demand-response commitment, and a third time as new headroom for compute. The agreement must identify the additional service being purchased, the constraint it relieves, the circumstances in which credit applies, and the meter and baseline used to verify delivery.
A workable arrangement credits a conservative portion of eligible relief, accounts for event duration and rebound, and withdraws that credit when delivery or topology changes. The site then returns to its approved fallback. The utility retains authority over limits, eligibility, switching, and override. The compute customer carries its procurement and performance obligations. That architecture is intended to contain risk; the controls and contract still have to demonstrate that they do so.
This is where a technical opportunity becomes a durable service right. The agreement must state the capacity, hours, constraint, curtailment priority, contingency treatment, and term of that right. It must also specify who pays for control and verification, who absorbs under-delivery or project exit, and how any remaining upgrade obligations are handled. Without those provisions, useful dispatch remains an experiment rather than a bankable connection arrangement.
5. A product and an institutional opportunity
The proposed product brings four elements together. The connection agreement defines what the site may consume. A private virtual power plant, or VPP, contract procures the resources that can improve that allowance. A limit-allocation engine translates approved headroom and verified resource schedules into site limits. Site controls enforce those limits at the meter. Each element solves a different part of the problem; none can substitute for the others.
The utility establishes the safety boundary, approves the electrical mapping, and can override the operating envelope. The developer funds its incremental requirements and remains accountable for compliance. An aggregator schedules eligible resources, manages recovery, and provides delivery records. Independent verification checks both site compliance and resource performance. Where a utility already dispatches a local resource program, the same economic arrangement could be implemented through a developer-funded rider that expands that program; private aggregation is the proposed default, not a necessary monopoly on dispatch.
DOE’s Standard Distribution Services Contract provides a starting point for qualification, operations, telemetry, measurement, and non-performance terms. DOE’s work on sourcing grid services frames the tradeoff between procurement and network investment. PNNL’s coordination work informs the division of responsibilities between utility and aggregator. Together, these provide design foundations; authorization for a load-side BYON arrangement remains a separate requirement.
The proposed software architecture combines PNNL’s IEEE 2030.5 stack and GridAPPS-D bridge with Voltra and Elastic’s Edge DERMS. The pilot will integrate import-limit control, a grid-aware allocation engine, dependable schedule updates, persistent telemetry, and compute power control. The resulting product joins the agreements and operating rules to the controls needed to enforce them.
Base Power’s account of targeted DER aggregation in ERCOT illustrates the importance of electrical location. Its performance claims and proposed nodal mechanism are company-reported; they do not establish regulatory authorization for the load-side service proposed here. A co-op or municipal utility may offer a practical pilot setting, but its approval of the connection and resource-crediting arrangement must still be secured.
The institutional task is to make the bargain repeatable. A developer should know what it is buying, a utility should know what remains under its control, and local participants should know what they will earn and what they are promising. Existing customers need a transparent account of the costs and benefits left with them. A standard package can reduce the effort of answering those questions at every connection.
This brings the argument back to affordability. Greater utilization can spread fixed costs. Customer-funded relief can avoid or defer some investment and reduce exposure to constrained hours. Participant payments can direct investment into local resources. Those benefits must exceed added supply, network, operating, and risk costs, and the resulting savings must reach existing customers through rates. The study tests whether the physical opportunity is large enough to pursue. The pilot must complete the economic and institutional case.
Part II. The study: what we tested and what it establishes
Our public-data study asks how much distributed compute can be served through flexible interconnections, how DER changes that opportunity, and which physical and contractual limits determine whether it can be used. It is a screening and design study. Its regional estimates identify a market to investigate; they do not replace a utility connection study or establish retail-bill savings.
6. Scope, data, and method
The screen covers 627 PG&E distribution substations and 62 Con Edison area substations for which public load shapes were available. PG&E’s data combine bank and feeder ratings, forecast loading, 12-month-by-24-hour substation shapes, customer and DER information, line-section capacity, new-load requests, and fire exposure. Con Edison supplies hourly forecasts for 95 networks, network-to-substation mappings, capability figures, load-capacity information, and planned transfers. Table 1 identifies the principal datasets and their roles.
Table 1. Study inputs.
| Source | What it gives |
|---|---|
| PG&E Distribution Resources Plan ArcGIS layers (updated Aug–Oct 2026) | Bank and feeder ratings and 2026–2040 forecast loading (layer 31); substation 12-month × 24-hour high/low load (layer 25); feeder customers by class and DER (layer 2); line-section load capacity, 2.1 million sections (layer 3); known and pending new load (layers 19, 33); high fire-threat districts (layer 18); DER forecasts (layer 12) |
| Con Edison system data | Hourly 2025–2027 forecasts for 95 networks (2024 weather); per-network load-curve sheets naming the area substation and its capability; EV load-capacity layers (radial feeders and banks); network transformer capacity buckets |
| Con Edison 2025 Marginal Cost of Service study | Area-substation load forecast 2025–2034; planned load transfers |
| 2025 Electric Service and Power Quality report (NY) | Network feeder counts, N-2 design, summer 2025 multi-contingency events |
| NYISO Zone J hourly load 2024–2025 | System-peak coincidence and NYC upstream limits |
| CPUC, NY PSC, NYISO, CAISO filings and industry sources | Tariff status, capacity prices, reliability needs, lead times (see References) |
For each station, the study solves for the largest flat compute block that remains within the selected planning limit in every modeled hour, with DER peak clipping bounded by both MW and hours per day. It then examines feeder limits, outages, fire exposure, queue information, and upstream constraints. Separate analyses test substitute DER and the difference between informal dispatch and contractual crediting. Verification includes independent recomputation, benchmark comparisons, and bulk-system feasibility checks.
The two utility datasets describe different service foundations. PG&E’s normal-rating headroom assumes curtailment during contingencies. Con Edison’s published capability already incorporates N−1 or N−2 planning. Their headline headroom figures cannot be added as though they represented the same reliability product. PG&E’s representative peak-day shapes also cannot establish annual availability with the same resolution as Con Edison’s hourly series.
7. Flexible access is the largest modeled unlock
At PG&E, changing from conventional N−1 planning to normal rating with automatic contingency runback increases modeled headroom from 0.44 GW to 6.45 GW, roughly fifteenfold. Adding a DER clip equal to 10% of peak for four hours raises it to 8.17 GW. At Con Edison, the corresponding DER case raises modeled headroom from 3.23 GW to 4.13 GW, on its already-firm capability basis. The finding is sequential: flexible service makes otherwise inaccessible headroom usable; DER can then make that service larger or more dependable.
Table 2. Capacity waterfall under the modeled planning limits and DER scenarios. PG&E normal-rating headroom and Con Edison firm capability use different reliability bases.
| Step | PG&E | Con Edison |
|---|---|---|
| Stations screened / nameplate | 627 / 29.7 GW | 62 / 17.1 GW capability |
| Firm room, conventional N-1 planning, no DER | 0.44 GW | 3.2 GW (capability already includes N-1/N-2) |
| Room at normal rating, no DER | 6.45 GW | 3.23 GW (firm basis) |
| Plus DER clip 10% of peak, 4 h | 8.17 GW | 4.13 GW |
| Plus DER clip 10%, in 2026 / 2034–35 | 9.76 / 5.94 GW (2035) | 5.12 / 3.76 GW (2034) |
| Plus DER clip 20% | 9.51 GW | 4.63 GW |
| After filters (overloaded removed; PG&E fire tier 3 removed; Con Ed capped by its published bank headroom and transfer-dependent room) | 8.04 GW | 3.40 GW |
| Existing feeders, sum of all feeder load capacity | 5.35 GW (loose upper bound) | 0.49 GW (radial stations only) |
| Existing feeders, best single feeder per station | 2.21 GW | 0.11 GW |
| Stations with ≥10 MW of room | 256 | 53 |
The intermediate rows are scenarios and filters, not independent quantities to add. PG&E’s 2030 normal-rating estimate declines as forecast demand grows: the 10%-clip case is 9.76 GW in 2026 and 5.94 GW in 2035. Con Edison’s corresponding values are 5.12 GW in 2026 and 3.76 GW in 2034. Capacity purchased today therefore needs a term, a reassessment process, and an explicit relationship to future load and upgrades.
The study’s utilization findings explain the economic interest. Mean load is about 32% of rating at the median PG&E substation, with a 25–37% range across forecast bases, and about 44% at Con Edison; median peak loading is 77% and 83%, respectively. At favorable sites, compute roughly doubles utilization and reduces station fixed cost per delivered kWh by 30–60%. That supports the hypothesis of more productive use of shared assets. It is a station-level cost result, not a 30–60% reduction in customer bills.
8. Deliverable capacity is smaller, and more distributed, than the paper ceiling
Feeder access narrows the opportunity sharply. The best feeder at the median PG&E substation has room for 4.7 MW without upgrades, and 53% of substations have no feeder that can accept 5 MW. A modeled 74 MW connection at Bakersfield would require about seven new 12 MW feeders and the positions to connect them. Of constrained PG&E line sections, 47% are thermally limited, 45% voltage-limited, and 8% both. Voltage relief requires appropriate inverter control and a validated feeder model; aggregate battery capacity alone does not establish it.
Con Edison’s network design requires equal care. At 9 of 29 stations with published transformer headroom, utility figures are lower than the screen’s estimate. Jamaica has no published room in the study’s current baseline; its relief depends on Idlewild in 2028. Five stations obtain modeled 2030 capacity through planned load transfers. Seven stations experienced 14 summer-2025 events with two or three feeders out, most lasting 10–36 hours. Manhattan’s N−2 design cannot be replaced by a short-duration peak-shaving assumption.
PG&E fire exposure adds a separate limitation: 110 substations fall in high fire-threat districts. Of those, 95 have modeled headroom totaling 643 MW, or 512 MW after the tier-3 exclusion. Shutoffs may last days and can de-energize offsite DER along with the load. Queue data identify nine data-center requests at six stations but redact requested MW, preventing a complete accounting of competing claims on headroom.
Once feeder capacity is available, the upstream system becomes decisive. The study estimates a PG&E ceiling of roughly 4 GW, with a 3–6 GW range, at 150–350 annual curtailment hours. About 2.9 GW of local headroom is in the Greater Bay Area, where transmission timing matters; roughly 3.5 GW in the Central Valley is more deliverable. PG&E’s 115/70 kV sub-transmission was not screened. In NYC, the study estimates about 2 GW, with a 1.5–2.5 GW range, at 100–300 curtailment hours; reaching 3.4 GW requires about 400–700 hours.
Table 3. Screening estimates of deliverable distributed compute.
| Measure | PG&E | Con Edison | Combined |
|---|---|---|---|
| Spare substation room on paper (2030) | 5–8 GW (normal rating) | 2.5–3.4 GW (firm) | not additive (different bases) |
| Deliverable by ~2030, with new feeders | 2–4 GW | 0.5–1.5 GW | 3–5 GW |
| Deliverable now, on existing feeders | 1–2 GW | 0.1–0.5 GW | 1–2.5 GW |
The resulting planning range is about 3–5 GW by around 2030 with feeder buildout, including about 1–2.5 GW on existing feeders in the study baseline. These are screening estimates, with the limitations described below. The theoretical energy maximum of roughly 100 TWh per year is not deliverable; the realistic tranche represents about 25–40 TWh. The analysis expects much of the incremental energy to be gas-supplied without additional clean-supply contracting, so the affordability case should not be presented as an automatic emissions benefit.
9. DER adds headroom and availability, subject to duration and additionality
The 10%-of-peak, four-hour clip adds about 1.7 GW at PG&E and 0.9 GW at Con Edison—roughly 25–30%. At about 200 PG&E stations and 27 Con Edison stations, at least a quarter of modeled compute headroom depends on DER. This supports targeted procurement rather than a uniform requirement for every connection.
The Con Edison hourly analysis finds that a block sized to spare room plus 10% of peak exceeds the limit for a median 70 hours per year over about 13 days, representing 0.11% of its energy; the worst day lasts about ten hours. Those local curtailment hours overlap only about 35% of NYC’s top 100 system hours. Local relief and system-peak response are therefore separate duties. At PG&E, 67% of substations peak on summer evenings, but 20% peak in winter and 29% of feeder limits bind in winter. Resource schedules must follow the site’s actual seasonal constraints.
Table 4. Substitute-DER sizing results. The PG&E and Con Edison availability criteria differ.
| Measure | PG&E (peak-day model) | Con Edison (hourly simulation) |
|---|---|---|
| Compute that fits with no DER | 6.45 GW | 3.23 GW (3.70 GW accepting ≤10 h/yr) |
| With substitute DER, near-zero self-curtailment (mid case) | ~7.6 GW with zero curtailment on peak-day shapes; full 8.3 GW at median 4.7 h/yr | ~4.1–4.3 GW at ≤10 h/yr |
| Contracted DER needed (mid) | ~1.9 GW (1.6 GW after derate) | ~0.8–0.9 GW |
| Main DER types | Managed EV, C&I demand response, home batteries, thermostats, ag pumping | C&I demand response and batteries (~78%); EV only ~7% (peaks are 2–4 p.m.) |
In this table, PG&E’s “zero curtailment” result refers to 12×24 peak-day shapes under normal rating. Con Edison’s threshold is no more than ten hours per year in an hourly simulation on firm capability. PG&E’s full 8.3 GW case has median modeled curtailment of 4.7 hours; Con Edison reaches about 4.1–4.3 GW within its ten-hour criterion. Those definitions must travel with the figures; neither is a guarantee through outages.
The modeled portfolio needs roughly 1.5–2 MW of contracted DER per additional MW of compute in favorable cases. A later thermostat-heavy simulation produces only 20–45% of nameplate as peak relief, supporting a more conservative 2–5× planning range unless long-duration commercial and industrial demand response and batteries justify less. Con Edison hot-day exceedances can last 7–14 hours. Energy duration, rebound, and coincident availability are often more important than enrolled MW.
Additionality reduces the usable pool. The PG&E mid-case estimate includes customers already participating in BIP or ELRP and EV demand already reflected in forecasts. Those resources cannot simply be counted again as new relief for the same hours. The creditable pool and the supported compute tranche must be recalculated after removing overlapping commitments and embedded forecast effects.
The study uses DER procurement estimates of $150–300/kW-year. At 1.5–2× sizing, that implies about $225,000–600,000 per MW-year of supported compute; at 2–5×, about $300,000–1.5 million. These are screening estimates, not supplier quotes. For workloads that can pause, the screening economics suggest self-curtailment is 2–4× cheaper. The commercially appropriate service depends on the customer’s actual interruption cost, resource procurement costs, and the resources available at the constraint.
10. Contract design determines how much relief becomes usable service
The five-station simulation is a test of mechanism. It applies PG&E-style operating rules to Con Edison load data, so it is neither an observed PG&E result nor a prediction for an approved Con Edison product. It nevertheless isolates a crucial question: does the customer’s permitted limit recognize the relief it has purchased?
Table 5. Informal dispatch versus recognized DER credit. Curtailed energy is relative to the no-DER baseline.
| Scenario | Curtailed energy vs no DER | Automatic overload trips per year, all 5 stations |
|---|---|---|
| No DER (baseline) | 100% | ~31 |
| Informal DER, current PG&E design | 87% | ~11 |
| Informal DER, rebound not managed | 136% (worse) | ~3× the informal case |
| Informal DER, forecast learns fast from measured load (best case) | 54% | ~42 |
| Same, then the DER stops mid-summer | 68% | ~51, real overload risk |
| Contract crediting day-ahead DER schedule | 39% | ~14 |
| Contract plus hourly limit updates | 24% | ~13 |
Informal DER reduces curtailed energy only modestly under the modeled day-ahead framework, although overload trips decline. Unmanaged rebound makes curtailed energy worse than the baseline. Allowing a forecast to learn from lower measured demand can raise availability, but also increases modeled trips; withdrawing the DER mid-summer creates further risk. Explicit schedule credit and hourly updates produce the largest reductions in curtailed energy in these comparisons.
The evidence supports a contract that recognizes schedules, verifies performance, controls rebound, and withdraws credit promptly when assumptions fail. It does not support unrestricted netting of the compute meter against offsite resources. The customer must continue obeying the utility-approved limit, and a pilot cannot claim a right to added import before that right has been authorized.
11. What remains to be proven
The study supports three parts of the hypothesis. First, conditional distribution capacity is large enough to justify a portfolio of smaller compute sites. Second, flexibility changes access more than DER alone, while targeted DER can materially improve the service. Third, operating rules and contractual crediting determine whether physical relief translates into useful customer capacity. The detailed bottleneck and controls work explains how a pilot can test these findings safely.
The scale remains uncertain. At PG&E, 38% of the no-DER headroom estimate—2.48 GW—comes from stations with missing bank forecasts and an assumed zero growth rate; correcting this gives roughly 4.3–5.5 GW. A 90%-of-rating planning limit reduces room by about one-third, and pooling banks can overstate a single-bank connection by 15–30%. Other biases point upward: summed forecasts are about 1.4 times recorded peaks, and roughly 1.4 GW of San Francisco and Oakland bank-group capacity is omitted. These sensitivities produce a broad theoretical range of 4–13 GW.
At Con Edison, conflicting capability figures at eight stations reduce estimated room by about 8% when the lower values are used. Station-level DER participation assumptions have roughly ±2× uncertainty, and borough-level customer counts limit local resolution. PG&E lacks a full hourly year in the supplied shapes; Con Edison’s forecast uses 2024 weather. Hotter weather, longer events, missing protection settings, unavailable breaker positions, and unscreened upstream constraints can all change deliverability.
The study does not yet establish a net reduction in existing customers’ bills, the amount of flexibility funding required to produce it, or a bankable tenant availability promise. Those depend on site engineering, procurement prices, supply and network costs, cost allocation, and rates. The next step is to test one complete arrangement: a real constraint, a real customer, qualified resources, an enforceable service agreement, and a bill-impact model that follows the value to existing customers.
Part III. Proving the complete bargain
The first pilot should demonstrate one complete connection arrangement at one utility-confirmed constraint. Its job is to show that a compute site can follow an enforceable operating envelope, that contracted resources deliver additional relief, and that the resulting economics can benefit existing customers. Regional scale is a reason to conduct the pilot; it is not a substitute for succeeding at that first site.
12. Choose one launch site and one approval path
Select a willing utility and compute customer around a binding transformer or feeder constraint that can be modeled, measured, and relieved. Require a feasible physical connection, a known firm fallback, manageable upstream restrictions, suitable compute controls, and a resource pool with adequate duration. Favor a site where the utility can supply the missing engineering data and agree to an independent evaluation.
A co-op or municipal utility is an attractive first-deployment candidate where its governance and existing resource programs permit a manageable approval process. PG&E is the principal pathway for translating the study into an investor-owned-utility service because the research already examines its flexible-connection framework. Con Edison provides a distinct network and regulatory test. These are alternatives for the first deployment and potential later replications, rather than a commitment to launch three pilots at once.
Table 6. Candidate stations identified by the capacity screen. Site selection requires utility confirmation of headroom, connection feasibility, and upstream constraints.
| Use | PG&E | Con Edison |
|---|---|---|
| DER unlocks (pairing story) | Bakersfield, Stockdale, Contra Costa, Lakewood, Brentwood, Llagas | Corona No. 1 and 2, Water Street, Glendale, East 179th St |
| Best for substitute DER | Tassajara, Edenvale, Castro Valley, Clayton, Lakewood | Brownsville No. 2, Bensonhurst No. 1, North Queens (Brownsville No. 1 and Bensonhurst No. 2: see Caution) |
| Large spare room | SF H (Martin), Trimble, Bay Meadows, Kern Oil, Hollister | North Queens, Leonard St No. 2, East 40th St No. 2, Seaport No. 1, Bensonhurst No. 1 |
| Caution | Lammers (upgrade likely committed); Bay Area stations (transmission timing); fire-tier stations | Jamaica (0 MW bank headroom until 2028); Bensonhurst No. 2 (0 MW published headroom, 2030 transfer); Brownsville No. 1 (capped at 79 MW published headroom, transfer-dependent); transfer-dependent stations; Manhattan (no feeder data, N-2) |
The regulatory baseline for this analysis is October 2026. Potential approval routes include PG&E’s R.21-06-017 process, an engineering-procedure letter within Flex Connect, and New York Case 26-E-0045. The scope of utility discretion, applicable approvals, filing status, and dates require confirmation before project commitments. An engineering letter is a route to investigate, not an established entitlement to offsite credit. A special contract or pilot rider may be needed before live import limits can reflect third-party relief.
The proposed development phase covers the first 0–3 months: site selection, data access, engineering review, commercial terms, and an approval request. A 6–12-month demonstration window follows, contingent on approvals, procurement, and commissioning. Expansion toward a standard service option depends on evidence and authorization.
13. Define the service, the contracts, and the responsibilities
Start with a connection schedule that names the binding equipment, the firm floor, conditional MW, and any tranche eligible for DER credit. Specify operating hours, event duration, runback time, curtailment order, abnormal switching, outages, communications failure, and restoration. The 12 MW example in Figure 1 can explain the structure, but actual tranche sizes must come from the site study.
The private VPP contract should define resource location and ownership, incremental availability, dispatch rights, performance measurement, rebound, and payment. Adapt the DOE Standard Distribution Services Contract as a starting point, with the compute customer as buyer where appropriate and legal review of the resulting obligations. Program overlap must be resolved by resource and hour; the same relief cannot support incompatible commitments or be paid for twice.
The pilot should begin with conservative crediting parameters: no more than 90% of a qualifying day-ahead schedule, a 10–20% holdback, and an initial cap on substitution—for example, 50%, with any increase toward 80% considered only after two satisfactory summers. An 85% credit factor provides an illustrative limit-engine setting. These parameters require reconciliation into one site-specific rule, including whether the holdback represents the same derating or an additional reserve.
Credit must reflect duration and verified delivery, with ex-post reconciliation, managed recharge, and immediate withdrawal under the agreed failure conditions. The contract must preserve the utility’s override and site fallback, define penalties and insurance, and allocate incremental control, measurement, administration, and settlement costs to the developer. Set financial security for under-delivery, demand reduction, and early exit. Define when the use-right expires or changes and how curtailment experience triggers an upgrade review; a threshold of roughly 100 curtailment hours per year is a candidate for evaluation, not an established rule.
14. Build the controls around the utility’s operating envelope
The pilot’s software architecture combines PNNL’s IEEE 2030.5 server, core library, client, and GridAPPS-D bridge with Voltra & Elastic’s edge DERMS. The protocol stack provides the foundation for secure communications, device registration, fleet management, and control delivery; the limit engine supplies the constraint-aware operating decisions. Implementation begins by confirming the selected software release, its supported import-limit fields, and the interfaces required by the site and aggregator.
The proposed limit engine sits beside the communications server. It takes a planning limit for each constraint, a base-load forecast, firm allocations, topology, approved DER schedules, and contract parameters. It calculates day-ahead site limits, allocates shared headroom under a published priority or pro-rata rule, and applies only the approved resource credit. It records revisions and reduces limits when headroom or resource delivery changes. The utility retains an override that returns affected sites to their approved fallback. Figure 3 shows the recurring operating-envelope cycle that this architecture must support.
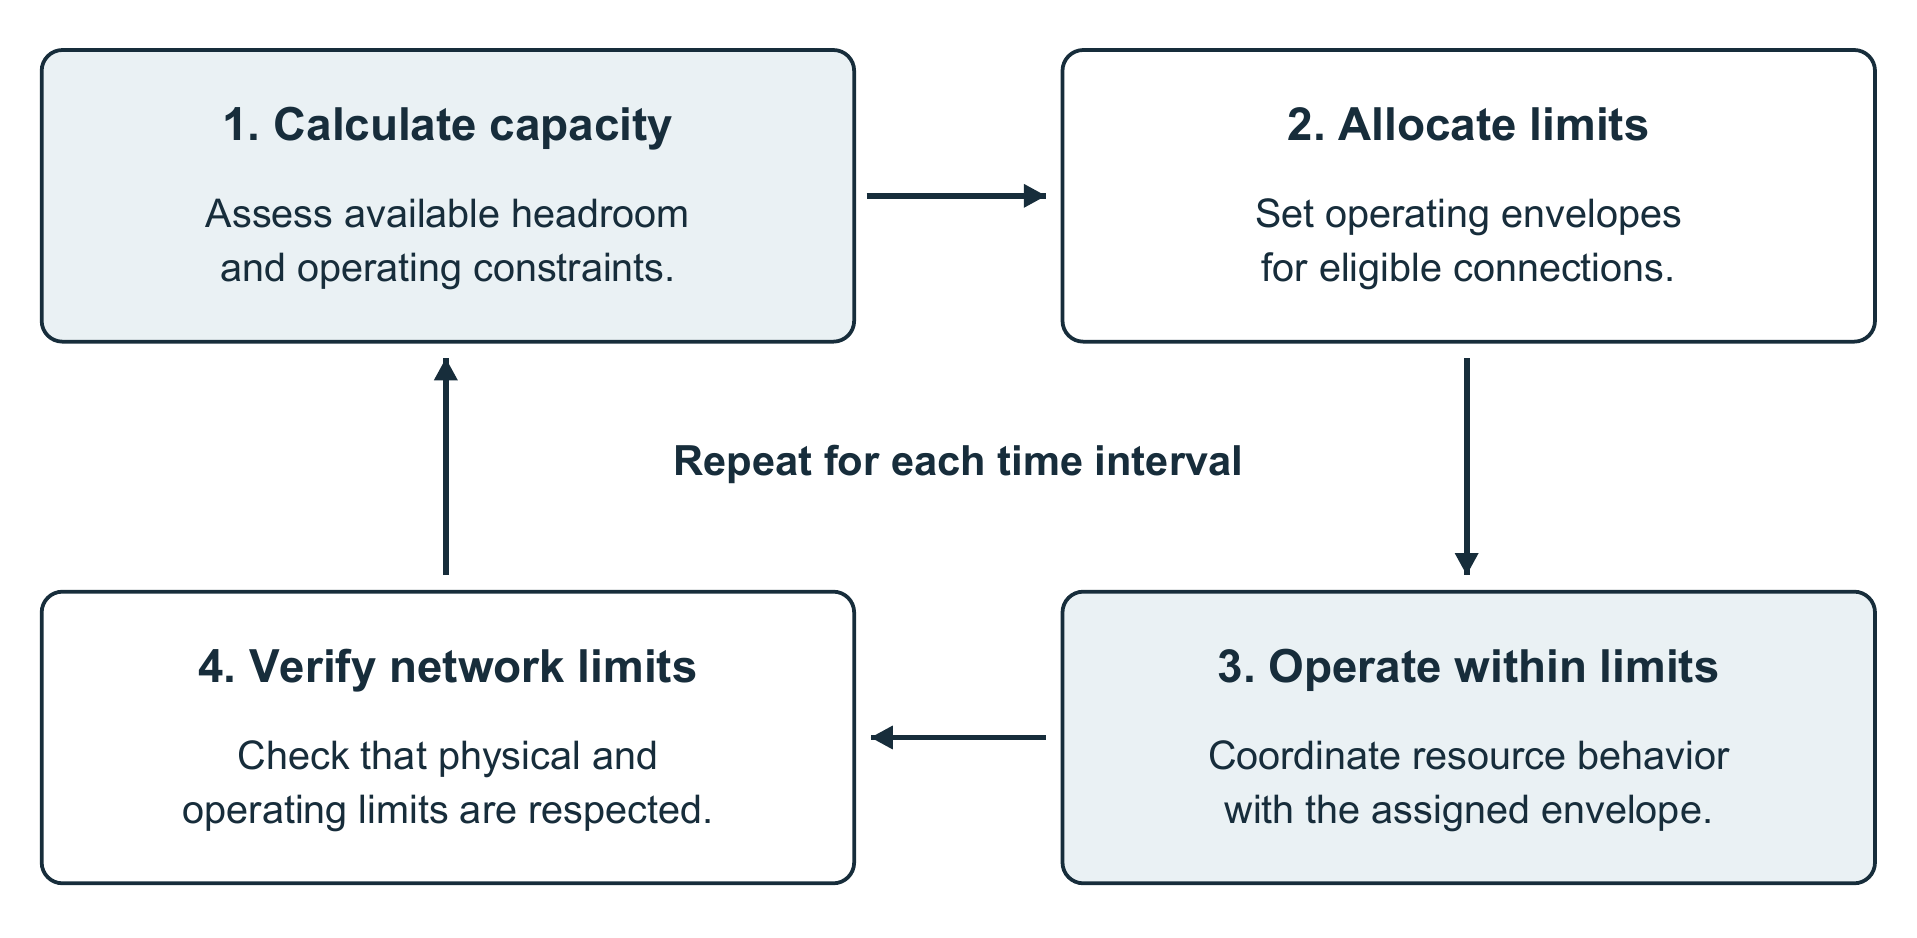
Figure 3. The operating-envelope cycle: calculate capacity, allocate limits, operate within them, and verify network constraints. Adapted from U.S. DOE, Flexible DER & EV Connections (2024), Figure 2, p. 6; source framework: ARENA.
The first engineering requirement is a site-import-limit instruction that caps consumption at the customer meter. Where the selected software release lacks the necessary CSIP-AUS fields, they must be added to the core schema and control catalog. The second is grid-aware reservation handling: an unanswered request cannot be approved solely because a fleet calendar is free. An external decision hook or a fail-closed setting must resolve requests safely when a response deadline expires.
The engine also needs an explicit mapping between sites, resources, and binding equipment; a dependable way to replace day-ahead schedules without partial updates; and persistent telemetry for delivery verification and settlement. The proposed architecture keeps the constraint model in the engine, with function-set groups as a limited pilot mapping. Batch schedule replacement, telemetry export, exceedance alerts, and scheduling-error records are concrete implementation tasks. The choice between a standalone server and the GridAPPS-D bridge should follow the utility’s operational environment.
At the site, the Edge DERMS needs an enforceable compute power-capping interface, through rack controls or the job scheduler, together with checkpointing, migration, and storage coordination where applicable. The commissioning targets are import-limit compliance within about 30 seconds and meter telemetry every 2–4 seconds, with fallback on communications loss. These are commissioning targets to validate against the utility’s protection and thermal requirements. Fast protection cannot depend on a remote software loop whose latency or availability has not been demonstrated.
The aggregator must submit DER schedules, receive acknowledgments, report delivery, and manage recovery. Resource telemetry and compute-meter telemetry serve different purposes: one establishes the relief that earns credit; the other establishes whether the customer obeyed its limit. Both need synchronized timestamps, retained records, and a defined response to missing or suspect data.
Table 7. Control signals, response times, and site actions. Final timings and fallback duties require utility approval for the selected site.
| Signal | Clock | Sent by | Site response |
|---|---|---|---|
| Planning envelope | At connection, yearly | Wires utility (Load Limit Letter) | Size firm vs flexible MW and storage |
| Day-ahead hourly limits | By 8 a.m. the day before | Utility DERMS over IEEE 2030.5 | Schedule jobs, pre-charge storage |
| Real-time limit | Seconds–minutes | Edge controller at bank or feeder | Throttle, discharge, reactive power |
| Contingency runback | Seconds, then 10–36 h | Utility protection / SCADA | Step to floor, migrate workloads, onsite supply |
| System peak event | Day-ahead plus hours | ISO or LSE | Curtail ~100 h/yr |
| Fire shutoff | Days ahead | PG&E emergency operations | Shut down or island |
15. How to validate in stages before crediting live capacity
Stage 1: Site model and commercial baseline. Correct missing forecasts, rerun the site at the utility’s planning margin, and examine feeder and upstream limits. Validate the screening result with current utility data, model normal and abnormal configurations, qualify resource duration and additionality, and establish the four service comparisons described below. Proceed only when the utility agrees on the constraint and fallback and the parties have a credible approval and funding path.
Stage 2: Bench and closed-loop tests. Combine the PNNL server and client simulators with the site controls under scripted headroom changes. Use GridAPPS-D and its bridge for power-flow simulation. Exercise DER shortfall, delayed messages, stale telemetry, forecast error, schedule replacement, switching, rebound, emergency override, and compute-control failure. Demonstrate that lost credit produces safe load reduction rather than an unearned import allowance.
Stage 3: Shadow operation. Run the schedules, forecasts, measurements, and settlement calculations against the real site without raising its authorized limit. Compare predicted relief with observed delivery, document baseline error and rebound, and test the reporting process with the utility and participants. This stage can build evidence while the crediting arrangement is under review, but must remain within existing permissions.
Stage 4: Capped live service. After written approval and commissioning, activate a small resource-backed tranche with explicit credit caps, reserve margins, and fallback. Increase exposure only after the predefined operational tests pass. Observe relevant peak seasons and sustained events; use controlled tests for failure modes that do not occur naturally. Preserve enough data for independent replication and do not infer annual availability from a short, mild-weather demonstration.
Stage 5: Review and replication. Publish or share an agreed evaluation covering compliance, resource delivery, curtailment, costs, customer impacts, and unresolved failures. Utility and regulatory review should determine whether to expand the tranche, add another site, modify the rider, or stop. Broader PG&E and New York proposals can then use the same evidence and contract structure, adapted to their different networks and approval requirements.
16. Test the developer bargain and the customer-bill hypothesis
The pilot needs two comparisons. First, determine the best way to serve the same compute load: conventional firm service with its required upgrades; flexible service with self-curtailment; flexible service with onsite storage; and flexible service backed by qualifying neighborhood or commercial resources. Hold the load, reliability obligations, weather, outage treatment, and clean-supply assumptions consistent. Compare energization timing, curtailed MWh, longest interruption, developer cost, resource duration, participant payments, remaining upgrades, and exit exposure.
Second, compare the system with and without the new compute customer. This establishes whether existing customers benefit from admitting the project at all. Model the change in energy and capacity procurement, transmission and distribution investment, losses, operations, controls, verification, utility-funded flexibility, and stranded obligations. Then account for the developer’s tariff payments and direct funding under the proposed allocation rules. Avoid counting a privately funded resource expense as a ratepayer cost, or counting the same avoided upgrade or payment as two separate benefits.
Follow the result through rates by customer class and over time. A positive project surplus does not automatically produce lower bills: the cost-recovery mechanism and timing determine who receives it. Report annual bill effects and long-run costs for representative households and businesses, including nonparticipants. Keep lower network charges, supply-cost changes, participant income, and resilience benefits distinct. Use sourced cost ranges, procurement quotes, and applicable tariffs to estimate the new customer’s net contribution.
The investment must satisfy both grid needs and participant economics (Figure 4). The community evaluation should show participant compensation, the share of developer spending reaching local resource owners, access for renters and customers without investment capital, and the backup capability actually reserved for community use. Specify asset ownership, maintenance, and exit terms so that a claimed lasting local benefit does not disappear when the compute contract ends.
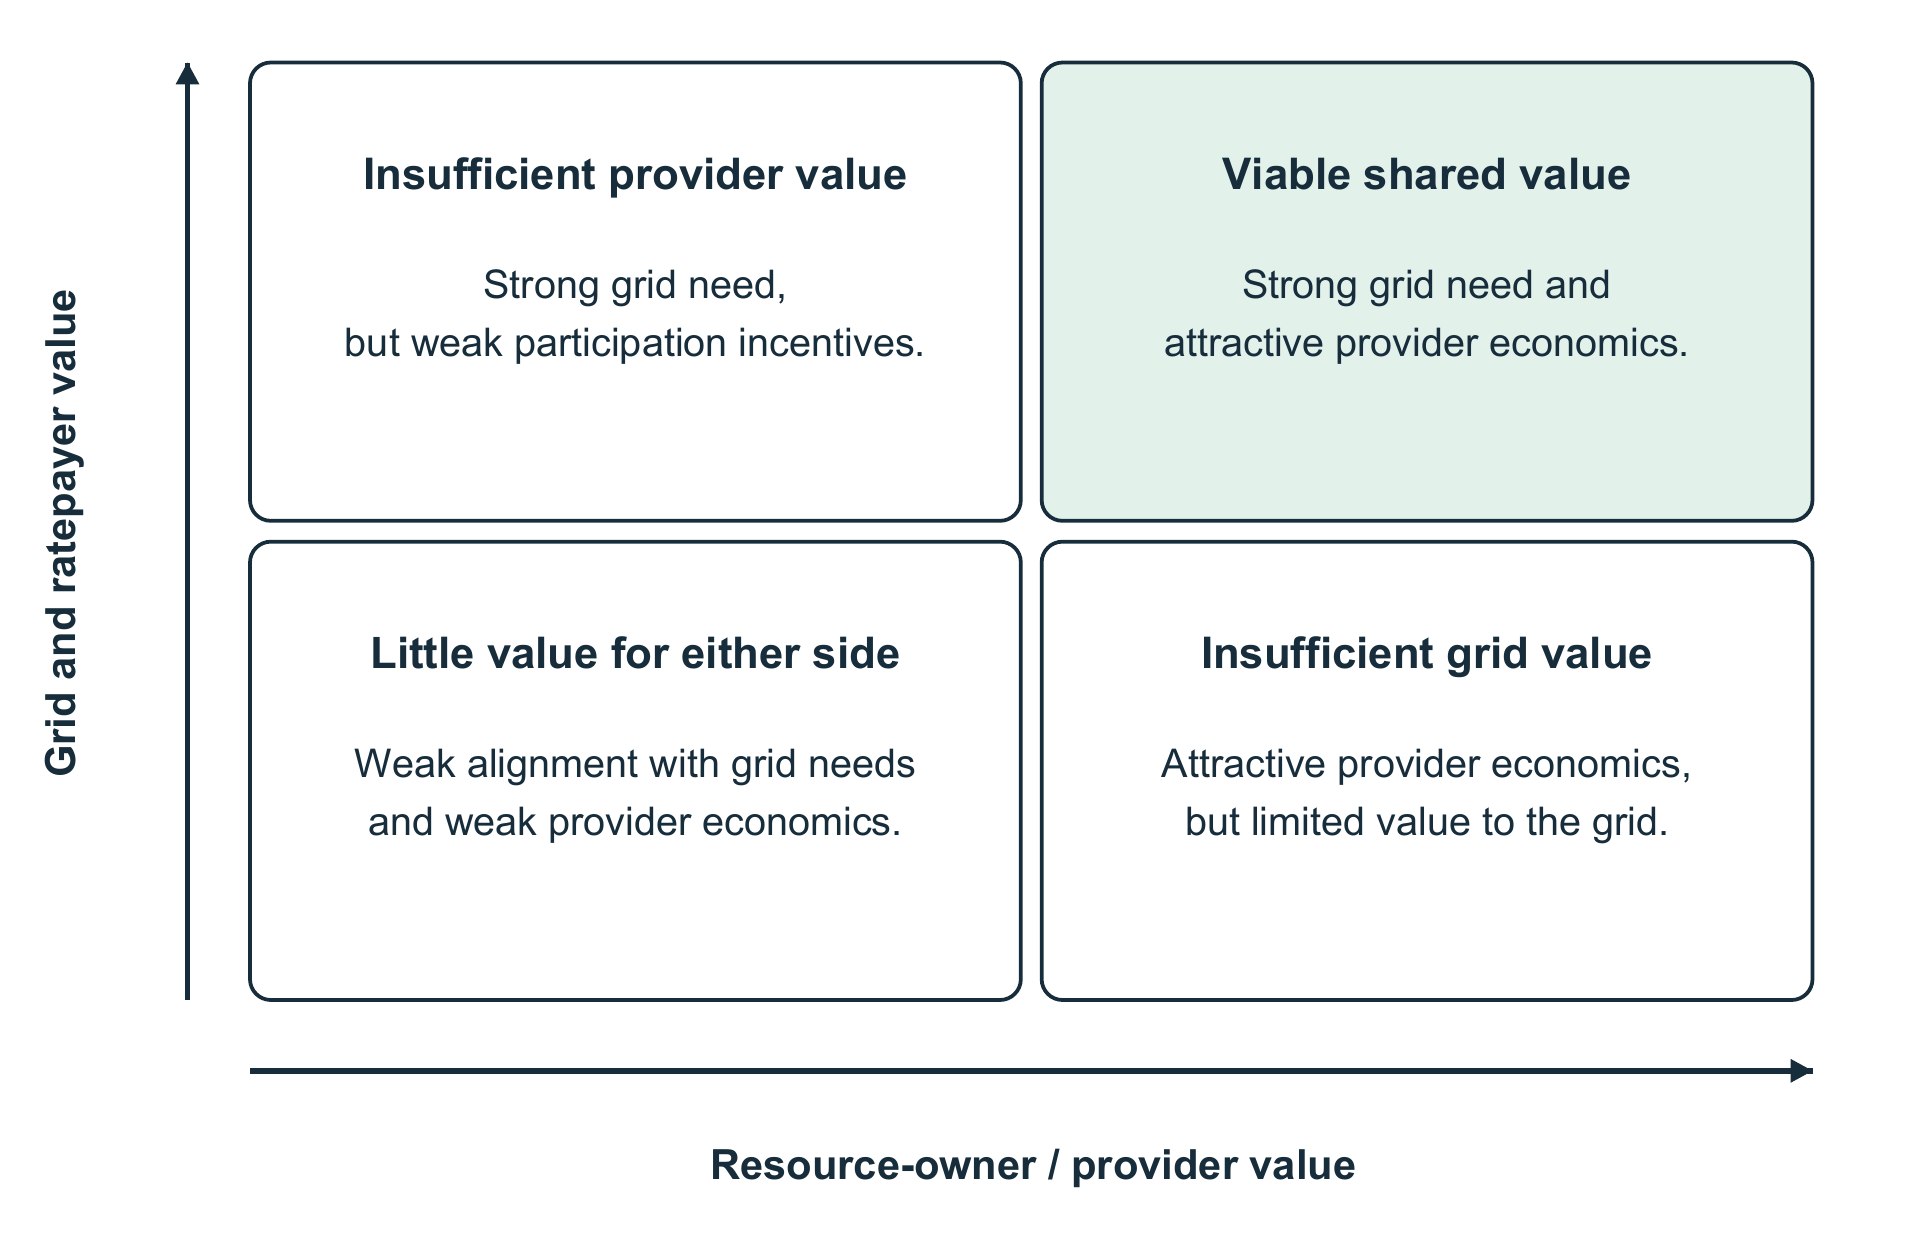
Figure 4. Grid and participant value must align for a resource arrangement to scale. Adapted from U.S. DOE, Sourcing Distributed Energy Resources for Distribution Grid Services (2024), Figure 6, p. 13; framework credited to S. Succar, ICF.
Stress-test higher energy prices, lower compute utilization, longer events, resource under-delivery, adverse weather, and early project exit. Report who bears each loss. The economic success criterion is a durable, attributable reduction in costs borne by existing customers under the applicable rates, alongside an investable developer proposition. Payments to participating resource owners alone do not satisfy the broader claim.
17. What a successful pilot leaves behind
The operational test is measured compliance with the approved envelope under normal operation and the commissioned failure cases. The resource test is additional, locationally effective relief with sufficient duration and controlled rebound. The commercial test is a service the developer can justify against self-curtailment, onsite storage, and conventional upgrades. The public-benefit test is a defensible path to lower costs for existing customers, including those who provide no flexibility.
Agree numerical acceptance thresholds before live operation using the site’s engineering requirements and contracted service levels. If relief is unreliable, lower or suspend credit. If economic benefits depend on unsupported assumptions, revise the funding or service terms before expansion. A technically successful control demonstration is useful evidence even if it shows that a particular resource portfolio or site does not meet the affordability test.
The repeatable output is a utility deployment package: a validated site model, a connection rider, a private VPP agreement, a limit engine and interoperable interfaces, commissioning procedures, an auditable settlement record, and an independent bill-impact assessment. That package turns an interesting map of spare capacity into a service that utilities, developers, and communities can evaluate on common terms.
A data center can bring more than demand. It can bring a new payer for shared infrastructure and a committed buyer for flexibility that the surrounding system needs. The PG&E and Con Edison study shows a physical opportunity large enough to pursue and identifies the conditions that limit it. The pilot must now demonstrate the complete bargain: dependable service for compute, funded obligations for the developer, useful value for local participants, and savings that reach existing customers.
References
62 sourcesShow allHide
- PG&E DRP layersservices2.arcgis.com
- Con Edison network 8760 forecastsconed.com
- Con Edison 2025 MCOSjointutilitiesofny.org
- 2025 Electric Service and Power Quality reportjointutilitiesofny.org
- CAISO peak historycaiso.com
- CAISO 2026 summer assessmentcaiso.com
- PG&E data-center pipelineutilitydive.com
- NYISO Q1 2025 STARnyiso.com
- NYISO NYC reliability neednyiso.com
- NY DPS summer 2025 preparedness (capacity prices)dps.ny.gov
- Modo Energy, NYISO capacity prices 2026modoenergy.com
- Transformer lead times (Wood Mackenzie via EE Power)eepower.com
- Duke Nicholas Institute, Rethinking Load Growthnicholasinstitute.duke.edu
- LBNL data-center energy reportenergy.gov
- PG&E Flex Connect fact sheet · technical requirementspge.com
- PG&E OpFlex report 2025cpuc.ca.gov
- PG&E R.24-01-018 filing, June 2025docs.cpuc.ca.gov
- D.26-02-025docs.cpuc.ca.gov
- AL 7868-Epge.com
- R.21-06-017 Track 3 proposed decisiondocs.cpuc.ca.gov
- PG&E comments July 2026docs.cpuc.ca.gov
- CPUC on Rule 30webproda.cpuc.ca.gov
- NY PSC Case 26-E-0045 orderrtoinsider.com
- Con Edison Smart Usage Rewards (DLRP/CSRP)coned.com
- PG&E 2026 ILP reportpge.com
- Brattle, Real Reliabilitybrattle.com
- UKPN curtailable connectionsdso.ukpowernetworks.co.uk
- BiTraDER (Ofgem)ofgem.gov.uk
- Google demand-response agreementsblog.google
- Texas SB 6utilitydive.com
- D.09-08-027 (DR dual participation)docs.cpuc.ca.gov
- PNNL IEEE 2030.5 servergithub.com
- PNNL IEEE 2030.5 core librarygithub.com
- GridAPPS-D 2030.5 bridgegithub.com
- PNNL-38909, Modular ADMS to Plug-and-Play Opsosti.gov
- PNNL-36923, i2X flexible interconnection technical assistancepnnl.gov
- Envoy (ANU, CSIP-Aus)github.com
- VOLTTRON IEEE 2030.5 agentvolttron.readthedocs.io
- DOE iCRS-D programenergywerx.org
- DOE, Sourcing DER for Distribution Grid Servicesenergy.gov
- DOE, Standard Distribution Services Contractenergy.gov
- DOE, Flexible DER & EV Connectionsenergy.gov
- PNNL, TSO-DSO-Aggregator Coordination Requirementspnnl.gov
- PNNL, State of Grid Edge Resource Utilizationpnnl.gov
- PNNL DSAT resourcespnnl.gov
- PNNL, data center controls for grid servicespnnl.gov
- PNNL grid architecturegridarchitecture.pnnl.gov
- De Martini webinar (LBNL)emp.lbl.gov
- Base Power, ADER Phase IV and the capacity crunchbasepowercompany.com
- ERCOT ADER pilotercot.com
- ERCOT market notice M-A030226-01ercot.com
- ERCOT large-load interconnection updateercot.com
- Base and Bandera Electricrenewableenergyworld.com
- Base and GVECutilitydive.com
- Base and Farmers Electricess-news.com
- Base and CoServpv-magazine-usa.com
- Base and Austin Energysecure.businesswire.com
- Texas SB 6 summary (Weil)weil.com
- CPUC Resolution E-5296 (limited generation profile)docs.cpuc.ca.gov
- SCE advice letters (5138-E)sce.com
- PJM Order 2222 compliance filinginsidelines.pjm.com
- EPRI Order 2222 workstreammsites.epri.com